CW3E Releases New Interactive Geospatial Observation and Forecast Maps
Spetember 18, 2017
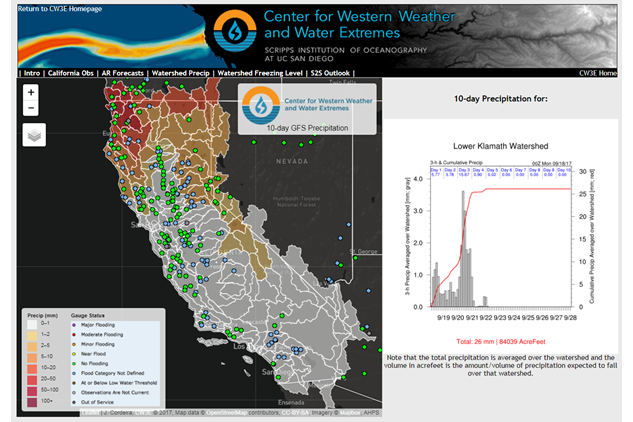
CW3E has released a new interactive mapping tool that takes advantage of “web mapping services”, GIS-based coding/thinking, and interactive technologies in order to provide dynamic weather analysis graphics in support of the CW3E mission. These interactive maps allow the user to display and interact with numerous variables from a synoptic to a watershed scale with the goal of providing insight into potential impacts of landfalling atmospheric rivers over California.
This interactive tool was developed as a means to geospatially visualize meteorological and hydrologic observations on a new platform and from a new perspective. This first set of maps/webpages illustrate the utility of the tool in displaying atmospheric river related forecast products and CW3E will continue to build upon the tool. As we continue to experiment in improving and expanding the tool, we encourage any feedback or suggestions. Please contact the website creator or the CW3E Webmaster with any questions or feedback you may have.
The development of the tool and maps/webpage is supported by the California Department of Water Resources. The page was created and developed by CW3E collaborator Dr. Jason Cordeira and CW3E Director Dr. F. Martin Ralph with input from CW3E researchers Brian Kawzenuk, Chad Hecht, and Dr. Julie Kalansky.
Click here to view the new interactive geospatial observation and forecast maps.