CW3E Publication Notice
Atmospheric river sectors: Definition and characteristics observed using dropsondes from 2014-2020 CalWater and AR Recon
December 23, 2020
Alison Cobb, a postdoctoral scholar at CW3E, recently published a paper in Monthly Weather Review, along with CW3E co-authors Allison Michaelis, Sam Iacobellis, Luca Delle Monache and F. Martin Ralph, titled “Atmospheric river sectors: Definition and characteristics observed using dropsondes from 2014-2020 CalWater and AR Recon” (Cobb et al. 2020). This study contributes to the goals of CW3E’s 2019-2024 Strategic Plan to support Atmospheric River (AR) Research and Applications by furthering out understanding of AR dynamics. In particular, this work examines atmospheric measurements over the Pacific.
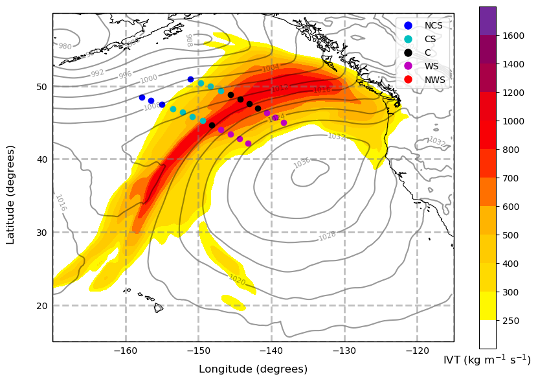
In this study, a unique set of 858 dropsondes deployed in lines transecting 33 ARs during CalWater and AR Recon field campaigns (2014-2020) are analyzed. Integrated vapor transport (IVT) is used to define five regions: core, cold and warm sectors, and non-AR cold and warm sides. The core is defined as having at least 80% of the maximum IVT in the transect. Remaining dropsondes with IVT > 250 kg m-1 s-1 are assigned to cold or warm sectors, and those outside of this threshold form non-AR sides. The mean widths of the three AR sectors are approximately 280 km. However, the core contains roughly 50% of all the water vapor transport (i.e., the total IVT), while the others each contain roughly 25%. A low-level jet occurs most often in the core and warm sector with mean maximum wind speeds of 28.3 and 21.7 m s-1, comparable to previous studies, although with heights approximately 300 m lower than previously reported. The core exhibits characteristics most favorable for adiabatic lifting to saturation by the California coastal range. On average, stability in the core is moist neutral, with considerable variability around the mean. A relaxed squared moist Brunt Väisälä frequency threshold shows ~8–12 % of core profiles exhibiting near-moist neutrality. The vertical distribution of IVT, which modulates orographic precipitation, varied across AR sectors, with 75% of IVT residing below 3115 m in the core.
The Cobb et al. (2020) study was the first of its kind to composite such a large dataset into different sectors of the AR. This analysis using only observations has revealed distinct characteristics across ARs when categorized into sectors based on IVT. There is symmetry across the AR in terms of TIVT, low-level jet wind speed, and lifting condensation level, but asymmetry in other diagnostics, including height of low-level jet and height below which 75 IVT is contained. Analyzing a large sample (858 dropsondes) has allowed for examination of the variability that is apparent in the ARs, rather than simply presenting mean characteristics, which have been reported in previous studies.
An important goal of AR observational campaigns is to retrieve data that will reduce forecast error and uncertainty in real-time. This study has shown the value of these observations to pure research, furthering the understanding of characteristics of ARs from observations. This simple technique for identifying sectors within an AR can be applied across a variety of studies, for example in forecast diagnostics and assessing model performance. Improvement in the forecast models would allow for better prediction of landfalling ARs that bring both beneficial and damaging precipitation to the U.S. West Coast. Results from this study can help to inform the sampling strategy of ARs, by further analyzing the sensitivity of forecasts to assimilation of dropsondes in different sectors, therefore helping to bridge the gap between observations and models. Following work also examines dropsondes in the sectors defined in this study to assess atmospheric reanalysis products, which is important as these are the closest we get to spatially homogeneous observations. This work supports ongoing collaborations involving CW3E, NOAA, NRL, U.S. Army Corps of Engineers, NCAR, and ECMWF.

Figure 1. Locations of dropsondes deployed during IOP5 2020, centered around 00 UTC 5th February. Color of dots reflects sector of dropsonde (see legend). Non-AR cold side (NCS), AR cold sector (CS), AR core (C), AR warm sector (WS), non-AR warm side (NWS). ERA5 IVT at central time shown in colored contours and mean sea level pressure shown in grey contour lines.

Figure 2. a) Composite vertical profiles of water vapor flux using 154 non-AR cold side, 197 cold sector, 247 core, 207 warm sector, 53 non-AR warm side dropsondes. 95% confidence interval shown at 500 m increments. b) Fraction of IVT for AR sectors (cold sector: CS, core: C, warm sector: WS). Mean shown in solid line and one standard deviation shown in shading. 0.5 and 0.75 fractions are shown in dashed vertical lines with the corresponding height value marked in triangles and stars on the y axis. c) Cumulative IVT with mean in solid line and one standard deviation in shading for all sectors.
Cobb, A., A. Michaelis, S. Iacobellis, F.M. Ralph, and L. Delle Monache, 2020: Atmospheric river sectors: Definition and characteristics observed using dropsondes from 2014-2020 CalWater and AR Recon. Mon. Wea. Rev., https://doi.org/10.1175/MWR-D-20-0177.1.
