
CW3E Publication Notice
A Climatology of Atmospheric Rivers and Associated Precipitation for the Seven US National Climate Assessment Regions
October 21, 2020
CW3E affiliates Duane Waliser, Bin Guan, and Andrew Martin joined Portland State PhD candidate and AR colloquium summer school attendee, Emily Slinskey, along with academic advisor Paul Loikith, on a recently published paper, titled “A Climatology of Atmospheric Rivers and Associated Precipitation for the Seven US National Climate Assessment Regions.” The article was published in the Journal of Hydrometeorology and will be featured in the November 2020 issue of the Bulletin of the American Meteorological Society.
Well-documented across the western United States (US), ARs are known for their important role in water resources as well as hydrometeorological extremes. However, research has shown that ARs are common and impactful in many regions across the Continental Unites States (CONUS; Fig. 1). To expand our understanding and documentation of regional AR impacts, the authors applied an objective AR detection algorithm to global reanalyses to enable a pointwise and regionally aggregated annual and seasonal understanding of AR frequency, physical characteristics, and impacts across the CONUS. Results are summarized over the seven US National Climate Assessment (NCA) regions to facilitate further incorporation of ARs and their impacts into ongoing and future climate assessments at regional scales. CW3E collaborators and affiliates that are authors on this paper are contributing to the goals set by CW3E in the 2019-2024 Strategic Plan to support “Atmospheric River Research and Applications” and “Monitoring and Projections of Climate Variability and Change”, especially as it applies to the National Climate Assessments.
Seasonal climatologies of AR frequency reveal ARs in the Northwest and Southwest are most common in the winter and fall, with greater than 10% of days having a detected AR. Although considerably less studied, AR occurrences east of the Rocky Mountains are observed across the annual cycle with notable maxima of greater than 12% in the Southeast in the winter and 10% in the Central US during the summer and shoulder seasons. Composites of IVT for cities exhibiting different AR climatologies across the CONUS further highlight regional variability among AR geometries and associated water vapor pathways.
In the West, coastal mountain ranges act as an efficient lifting mechanism for the moisture in ARs, resulting in ample precipitation and preventing most ARs from penetrating inland. Higher levels of background moisture and a more diverse array of precipitation triggering mechanisms in the East likely explain differences in AR occurrence and associated precipitation impacts compared to the West. Investigating AR IVT magnitude reveals that the Northeast experiences the strongest ARs, with seasonal average values upwards of 450 kg m-1 s-1. Detected ARs linked with high resolution precipitation measurements show that ARs are responsible for up to 50% of the total precipitation that falls over parts of the Northwest and Southwest during the fall and winter as well as across the Midwest and Southeast during the spring. Together, these results demonstrate that ARs are strong and impactful in regions beyond the western US.
Analysis of AR-associated precipitation shows that a substantial proportion of extreme precipitation days, defined as the highest 5% of three-day precipitation totals, are associated with ARs over many parts of the CONUS, including the eastern US (Fig. 1). However, the seasonality of linked AR extreme precipitation days is starkly different across regions. For example, across the Northwest close to 75% of extreme precipitation days are linked to ARs in the winter, while across the Midwest and southern Great Plains ARs play an important role during the summer with over 50% of extreme precipitation days related to an AR. These findings demonstrate the importance of ARs in regional weather, climate, and hydrology across the CONUS. Results also provide a target for climate model validation and a benchmark for quantifying projections of change in future AR characteristics under global warming.
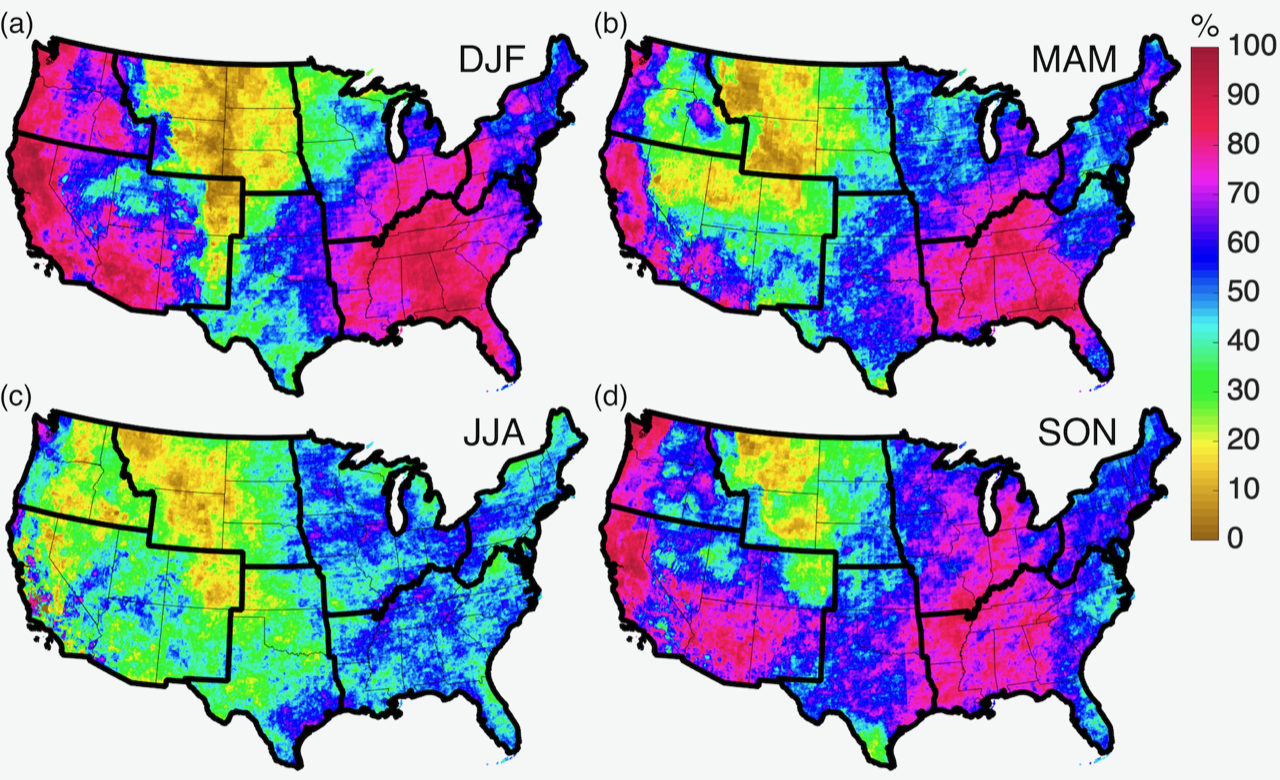
Figure 1. AR extreme precipitation fraction (% of days) calculated as the number of linked 95th percentile extreme precipitation AR days relative to the total number of extreme precipitation days between 1981-2016 at each grid cell. Results are for (a) December, January, and February; (b) March, April, and May; (c) June, July, and August; and (d) September, October, and November.
Slinskey, E.A., P.C. Loikith, D.E. Waliser, B. Guan, and A. Martin, 2020: A Climatology of Atmospheric Rivers and Associated Precipitation for the Seven US National Climate Assessment Regions. J. Hydrometeor., 21, 2439-2456, https://doi.org/10.1175/JHM-D-20-0039.1.