
Characteristics and Impacts of the April 4-11 2020 Cutoff Low Storm in California
June 3, 2020
Nina Oakley, Marian de Orla-Barile, Ben Hatchett (Desert Research Institute), Paul Burgess (CA Geological Survey), Marty Ralph
Main points:
- Cutoff lows can generate significant springtime precipitation, as evidenced in the April 4-11 2020 event that bolstered water resources throughout California and caused damaging landslides in San Diego County.
- Cutoff lows commonly produce unusual weather patterns and out-of-season precipitation and are notoriously challenging to forecast.
- Improved understanding of cutoff low characteristics and forecast challenges will support water resource and emergency management.

Figure 1: GOES-West TrueColor image showing the cutoff low over Southern California at 22:00 UTC on April 10 2020. Source: NOAA NESDIS STAR
A large cutoff low-pressure system impacted California from April 4 through April 11 (Fig 1).
Cutoff low-pressure systems are so called because they are “cut off” from the mean westerly flow (or “jet stream”). This allows them to persist over an area for an extended period of time, which may result in unusual weather patterns and often persistent precipitation. These features are a typical springtime phenomenon in the western US (see here and here) as the jet stream retracts poleward. Precipitation totals and impacts from cutoff lows vary greatly from year to year. For example, Oakley and Redmond (2014) found that anywhere from 15-80% of October-May precipitation in Los Angeles was associated with cutoff lows with no clear temporal trend over the period of 1948-2010.
Following well-below normal winter precipitation totals, this late-season storm produced beneficial Sierra Nevada snowfall as well as record-breaking rainfall in Southern California, bolstering water resources throughout the state. In Southern California, this precipitation suppressed fire weather and drought concerns, but also caused numerous damaging landslides in northern San Diego County. Here, we describe some of the unique characteristics of this storm, its impacts, and pathways forward for studying and forecasting cutoff low storms.

Figure 2: April precipitation was near to slightly above normal in central California and the Sierra Nevada and 200-800% of normal across much of Southern California. Nearly all precipitation in this area was associated with the April 4-11 storm. April precipitation was generally below normal elsewhere in the West. Source: HPRCC
Figure 3: Synoptic map for 0000 UTC April 4 – 2300 UTC 11 April 2020 with integrated water vapor transport (kg m-1 s-1, filled contours), 300 hPa winds (barbs), and 500 hPa heights (decameters, red contours). Data source: ERA5
The cutoff low approached the California coast on April 4th and began making its way down the California coast by the 5th. Precipitation began in coastal California and the Sierra Nevada by April 4th. The cutoff low was initially accompanied by a weak atmospheric river (ranking as 1 on the AR Scale; IVT of 250-400 kg/m/s) along its southeastern flank. The cutoff low system ushered in cold air; daily average temperatures dropped more than 10°F (5.5°C) below normal at many Sierra Nevada locations during the event. The snow level (elevation above which rain transitions to snow) during the event hovered around 5000-6000 ft in the Sierra Nevada, allowing much of the mountain precipitation to fall as snow. In the Transverse Ranges of southern California, snow levels ranged from 6000 to 7000 ft.
The AR/cutoff low combination began to produce precipitation over Southern California on April 6. By April 7, the center of the cutoff was offshore of Pt. Conception with a weakening plume of moisture remaining over San Diego County. A period of enhanced moisture transport occurred towards the end of the day on April 7 as a weak embedded disturbance moved through the cutoff low. This produced an additional period of moderate to heavy precipitation in San Diego County from April 7th into the 8th.

Figure 4: HYSPLIT model back trajectory for a point in San Diego County shows transport occurring from the Mojave and Sonoran Desert regions, over the Sierra Nevada and Coast Ranges, flowing offshore, and back into San Diego County in a cyclonic (counter-clockwise) manner. This transport of moisture supported persistent precipitation in Southern California, and the elevated nature of this transport is consistent with the deep saturated layer observed in the latter part of this storm (see Fig 5). Trajectory created with HYSPLIT
The cutoff low began to move east during the latter part of the 8th and was centered over the southern California/Nevada border by the 9th. During this time, a transition from widespread precipitation to scattered showers and thunderstorms occurred over San Diego County and surrounding areas as the atmospheric river weakened and moved southeast. The cutoff low system then began to retrograde westward, with the center meandering west and becoming situated over southern California again late on the 9th. Winds wrapped around the cutoff low, transporting moisture from the Mojave and Sonoran Desert regions in a counter-clockwise fashion. This configuration supported moisture transport over the Sierra Nevada and Coast Ranges, offshore, and back into southern California (Fig 4). The most prominent moisture pathway was through the characteristically lower terrain of the northern Sierra Nevada and San Francisco Bay Area terrain gaps. Under typical conditions of westerly flow, these areas are common corridors for eastward-traveling atmospheric river moisture to reach the Sierra Nevada and further inland. This “roundabout” moisture transport supported a period of upslope flow and precipitation along the eastern slopes of the Sierra Nevada as well as another period of widespread precipitation for coastal Southern California on April 9th and 10th. As the upper level cutoff center moved south and became situated over the Southern California Bight late on the 10th, the associated moisture plume weakened and moved into northern Baja. Widespread showers gave way to light showers and localized thunderstorms. The system exited to the east on the 11th with showers tapering off in Southern California.
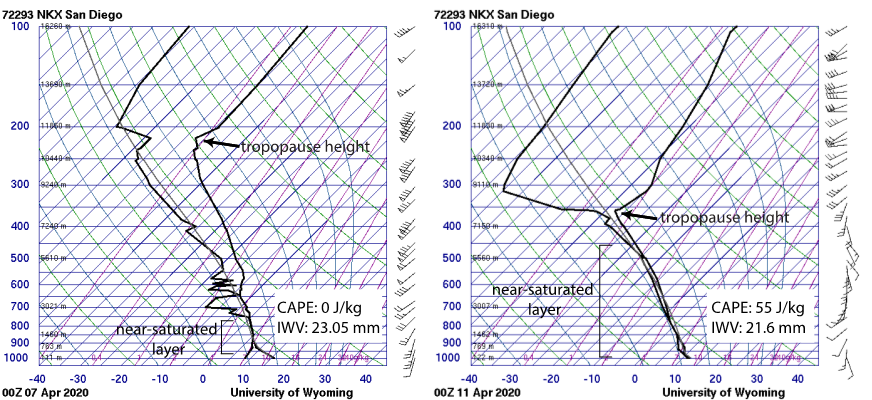
Figure 5: Atmospheric soundings from San Diego (left) at 00 UTC April 7 2020, under atmospheric river conditions and (right) at 00 UTC April 11 2020 under cutoff low conditions. Note tropopause height is much lower (~350 mb) under cutoff low conditions (right) as compared to AR conditions (~225 mb, left); a depressed tropopause is a well-known characteristic of cutoff lows. The amount of integrated water vapor (IWV) is similar in both cases, though the near-saturated to saturated layer is much more shallow under AR conditions (below ~750 mb, left) and much deeper (below ~450 mb, right) in the cutoff low scenario, associated with long-range upper-level moisture transport described in Fig 2 and 3. Source: U. Wyoming
Precipitation Impacts in Northern California and the Sierra Nevada

Figure 6: Change in Sierra Nevada snow water equivalent (SWE) in mm, April 11 2020 minus April 4 2020. A change of 50 mm corresponds to approximately 2 inches of SWE. Panel a) depicts the Sierra Nevada, panels b) and c) zoom in on the Yuba and Feather River watersheds and the Tuolumne watershed, respectively. Watershed boundaries are shown in red. Data source: SNODAS
In northern California, the precipitation associated with this event was not outstanding, but produced a modest late-season precipitation and snowpack increase in an otherwise drier than normal year. Most Sierra Nevada locations received 2-5 inches (50-125 mm) of liquid precipitation over the course of the storm. This was the only significant precipitation event of the month and brought monthly totals near to slightly above normal (Fig 2). The below normal temperatures and moderately low snow levels (~5000-6000 ft; characteristic of a typical winter storm) produced beneficial snowfall over a large area of the Sierra Nevada. Simulated snow water equivalent increased by up to 150 mm (6 in) from this event (Fig 6), with the greatest increases occurring in the central and southern Sierra Nevada. This event produced a 7-14% increase in percent of April 1 average snowpack across the state (Fig 7).
The precipitation totals and snowpack increases associated with this storm were not outstanding compared to a substantial winter storm, though the timing and context in the water year are noteworthy. On April 1, statewide SWE was reported as 54% of normal, brewing concern among water resource managers. This storm raised statewide average snowpack to 65% of average for April 11, with an increase of 10% in the northern Sierra, 12% in the central Sierra, and 16% in the southern Sierra (Fig 7). While it did not erase water resource concerns for the Water Year 2020, it provided a welcome late season addition to the otherwise well-below average snowpack.

Figure 7: Percent of April 1 average and percent of normal for date in three regions of California for April 4, prior to storm (left), and April 11, following storm (right). Source: California Department of Water Resources/CDEC.
CW3E’s northern California focus watersheds are the Russian River, the Yuba and Feather Rivers, and the Tuolumne River. This storm did not favor the Russian River Basin; most stations in the region received less than 1 inch of precipitation and reported April precipitation totals below 50% of normal. In the Yuba and Feather basins, precipitation totals were near to slightly above normal. Quincy recorded 2.43 inches for the storm and 88% of normal for the month. Portola observed 1.47 inches for the storm and 127% of normal for the month. Strawberry Valley observed 5.20 inches, 82% of normal for April. Further south on the Tuolumne River, Hetch Hetchy reported 2.76 inches for the storm and 3.34 inches for the month, which was 101% of normal for April. As much of the precipitation fell as snow above 5000 ft, there was not a pronounced increase in flow on either the Yuba, Feather, or Tuolumne Rivers. In all three watersheds, runoff associated with the storm did not stand out substantially from the seasonal snowmelt signal of the rising limb of the spring hydrograph.
Precipitation Impacts in Southern California and San Diego County
Precipitation totals and impacts were much more anomalous in Southern California, with totals over the 7-day period from April 5-11 in excess of 5-7 inches at some coastal locations (Fig 8). The northern part of San Diego County observed particularly notable precipitation totals. Miramar NAS recorded 5.07 inches for the month, its wettest April on record (1947-present), crushing the previous record of 3.84 inches set in 1965. Normal April rainfall at this location is 0.81 inches. Palomar Airport recorded 6.41 inches, the wettest April in its relatively short record (1998-present) and more than half of its typical annual precipitation (11.84 inches). A unique characteristic of this event was the persistence of the cutoff low over the area for multiple days and the transport of moisture from various locations throughout its duration, producing precipitation over a seven-day period. In contrast, a progressive (eastward moving) disturbance embedded in the jet stream typically produces only a few days of rainfall.

Figure 8: Event accumulated precipitation (top) and 15-minute precipitation depth (bottom) for six San Diego County ALERT network gauges. Gauge locations are shown in Fig 8. The vertical grey bar indicates the maximum 15-minute intensities in northern San Diego County and the presumed time of greatest landslide occurrence. Source: San Diego County Flood Control District
Precipitation from this multi-day event increased soil moisture in much of San Diego County. Towards the end of the event, an isolated thunderstorm produced 0.67 inches of precipitation in 15 minutes near Encinitas (Fig 8, 9) late in the afternoon on April 10 (23:50 UTC 10th). This corresponds to a 500-year precipitation event according to NOAA Atlas 14. Numerous field-verified landslides were reported in this area (Fig 10), including one large shallow landslide that mobilized as a debris flow between 5 and 6 pm PDT on April 10, according to eyewitnesses, and at the same time the highest intensity rainfall observations occurred in Encinitas (Fig 8). This landslide and debris flow caused at least $300K worth of damage to the San Dieguito Tennis Club in Encinitas. The reported landslides were confined to the area of this intense thunderstorm (Fig 9), suggesting that the combination of the antecedent rainfall and the burst of high-intensity rainfall were both important components needed to produce the concentrated impacts observed throughout the Encinitas and Solana Beach communities (Fig 8, 9).

Figure 9: Maps showing radar reflectivity at 23:47 UTC (16:47 PDT) and location of gauges used in Fig 7 (circles) and reported landslides (triangles). Map on right zooms in to show detail in the black box in map on left. Landslide locations from California Geological Survey Landslide Inventory. Radar data from NOAA Weather and Climate Toolkit.

Figure 10: (a) A shallow landslide that mobilized into a debris flow was observed the evening of April 10 at the San Dieguito Tennis Club in Encinitas, and (b) a shallow landslide observed at a home in Solana Beach. Both are presumed to have occurred following high intensity rainfall (Fig 9) on an area that had received several inches of rain over the prior days (Fig 8). Image (a) courtesy of San Dieguito Tennis Club and image (b) courtesy Douglas Alden, UCSD/SIO.
One of CW3E’s southern California focus areas is the Santa Ana River Basin. During this event, stations within the Santa Ana River watershed received anywhere from 250% to more than 400% of normal April monthly precipitation. This precipitation produced beneficial runoff into the Santa Ana River, supporting Orange County Water District’s groundwater recharge efforts. The maximum daily discharge for this event for the USGS gage Santa Ana River at MWD Crossing (above Prado Dam, Fig 11) was 943 cfs, the 7th highest April daily discharge since records began in 1970, and exceeds the 99th percentile daily discharge for April.
What next? Forecast challenges and other concerns raised by this event

Figure 11: Hydrograph of Water Year 2020 through late May on the Santa Ana River at MWD Crossing (above Prado Dam). This location is upstream of the Orange County Water District recharge projects. Source: USGS
In portions of the Yuba and Feather River basins, precipitation forecasts issued three days in advance were more than 1 inch below observed values for the 24-hour period ending April 5. This corresponded to precipitation observations at some locations being more than 200% of forecast amounts (Fig 12, left). In San Diego County, the differences between forecast and observed were more profound. In the Encinitas area in the coastal northern part of the county, at a three-day lead time, forecast precipitation for a 24-hour period ending April 11 was roughly 0.25 to 0.35 inches. The observed precipitation estimates are in excess of 2.5 inches. This represents an under-forecast of 2.25 inches, or ~90% (Fig 12, right). Even at a one-day lead time (not shown), precipitation estimates for northern San Diego County were still 1-2 inches below observed. This event showcases the challenge of accurately predicting precipitation associated with a cutoff low even at relatively short (1-3 day) lead times.

Figure 12: Left: Difference in precipitation forecast at a three-day lead and estimated observed precipitation for Northern California for a 24-hour period ending at 4 am PST April 5. Right: Difference in precipitation forecast at a three-day lead and estimated observed precipitation for a portion of Southern California for a 24-hour period ending at 4 am PST April 11. Data and image source: CNFRC
This persistent April cutoff low event produced late season snowfall and sustained precipitation in California, tempering water resource concerns in a well-below normal precipitation year. This event attests to the fact that, in an otherwise dry year, there is a possibility for significant spring rainfall through events with climatologically anomalous characteristics. The trajectories of cutoff lows and their associated precipitation are not will simulated by operational weather forecast models or sufficiently represented in seasonal-to-subseasonal forecasting. They are also not well-resolved in climate projections. This is due to several factors: 1) their detachment from the mean westerly flow and ability to meander and persist for multiple days; 2) their capacity to transport moisture in unusual patterns; and 3) their likelihood of triggering convection (thunderstorms) and intense rainfall by bringing in cold air aloft that destabilizes the atmosphere.
Cutoff lows, with or without atmospheric rivers, have a notable influence on springtime precipitation in California. They can slow the start of the wildfire season, extend the ski season, and contribute to spring wildflower blooms. By focusing efforts on understanding the range of characteristics and impacts of cutoff lows, we can improve forecasts to support water resource and emergency management.